Since it has already been proven numerous times that the official narrative about the March 11, 2011, earthquake in Japan is not the truth, that there wasn’t an earthquake with a 9.0 magnitude that occurred that day, and given the fact that practically all traces of the original early reporting have suspiciously disappeared it is required to backtrack the true values of the earthquake magnitude and intensity. Doing so will lead to a more credible result than that that the official narrative puts forward and it will help people to better understand the actual situation of that day in Japan, on March 11, 2011.
Keep in mind that the listed animation/chart in cartoon format (image 4), provided and used by the Japan Meteorological Agency (JMA), describes and indicates the seismic intensity of an earthquake, and that the Japan Meteorological Agency issues the seismic intensity information within about two minutes from an earthquake to provide information on the regions where seismic intensity of 3 or more was observed, and that the location and magnitude of an earthquake is determined within about three minutes. In case of no tsunamigenic earthquake, the message of “Tsunami is not expected” is added. That message was more than likely added on March 11, since most people were surprised and unprepared when the tsunami arrived.
According to the official story the strongest earthquake magnitude recorded on March 11, 2011, was 9.0. This would therefore equal an intensity of XII (12) on the Modified Mercalli Scale or an intensity of VII (7) on the JMA Scale.
Lets compare this with what is being stated by the Japan Meteorological Agency in image 4.
7 (VII) on the JMA Scale is the last table and the strongest value, it describes:
- “Wooden houses with low earthquake resistance are even more likely to lean or collapse”
- “Wooden houses with high earthquake resistance may lean in some cases”
- “Reinforced-concrete buildings with low earthquake resistance are more likely to collapse”
- And most importantly here is that it does not even describe anymore how people will react, how they would move because in the previous value 6 (VI) it is stated that “it is impossible to move without crawling. People may be thrown through the air.” What could possibly be more intense than being thrown in the air?
Taking the above information in account, and even if we would use the strongest officially recorded earthquake intensity of 6.67, it can be confirmed that the official story and the accompanying values of the earthquake magnitude and intensity are not the true values, that the official story is not the truth, since no one has been seen being thrown in the air nor was there widespread earthquake damage anywhere in Japan [1, 2]. All the major damage was caused by the tsunami!
Not to mention how bad the USGS has failed to edit their chart correctly (image 2), while they were rushing to make the official narrative look authentic.
Therefore, lets take a look at what the real situation was like, based on actual video material of that day in Japan, on March 11, 2011.
A news room in Sendai:
Video link: http://www.youtube.com/watch?v=Vx3ELotauVM
14:46 on March 11, 2011 earthquake Health Development:
Video link: http://www.youtube.com/watch?v=26cDWmeSH-s
Smile! “Japan Earthquake My Experience March 11, 2011:”
(Here they actually say and confirm that the Miyagi prefecture was hit by a 7.0 magnitude earthquake. This also confirms the real first reports claiming the same and claiming that the strongest earthquake magnitude was ON LAND, not at sea. This can be proven with the official chart that they forgot to edit/manipulate that indeed indicates that the strongest earthquake, on land, occurred in the Miyagi prefecture. The official story only began to change when the USGS started to interfere and manipulate the situation and the values of both the magnitude and the intensity.)
Video link: http://www.youtube.com/watch?v=fhvq4-g2v6Q
Japan Earthquake Miyagi Restaurant:
Video link: http://www.youtube.com/watch?v=7Oh8J25e2Oo
OK, now lets go back to the JMA Scale and lets be generous while determining the true value of the earthquake intensity. Based on the descriptions of the JMA Scale selecting the “6 Lower” table can be considered as being generous since it states that “it’s difficult to remain standing.” The “6 Upper” table is too much since nobody is seen being thrown through the air. The “5 Upper” table might not satisfy the majority of the public, therefore the “6 Lower” table is more than acceptable.
The “6 Lower” earthquake intensity value equals 10 (X) on the Modified Mercalli Scale, which equals an earthquake magnitude of 7 on the Richter Scale. This value perfectly matches the 7.0 that was originally reported as being the strongest earthquake magnitude ON LAND (not at sea) in the Miyagi prefecture and as stated by the smiling drama queen. This would also explain why Dr. Robert Jacobs didn’t feel or know a thing of/about the earthquake, in Hiroshima, until his friends called him on the phone to ask him if he was OK.
Since the strongest earthquake magnitude value (7.0) was recorded and reported in Miyagi and not at sea, the official narrative regarding the alleged (FAKE) 9.0 magnitude is again proven to be a fraud.
The fact that the earthquake data has been tampered with by the USGS gives it therefore all the more reason to put trust into the investigations that the tsunami did not occur naturally, that it was triggered on purpose, which would have to be qualified as eco-terrorism and an act of war [1, 2] rather than as an “accident” like the official story wants us to believe.
Image 1 (Missouri Department of Natural Resources)

Image 2 (here the USGS clearly failed to edit their chart correctly, this is proof that they are tampering with the real data and that the official story is not the truth! We will not base our investigation on this chart, image 2, because as you can see the most intense magnitude value, 7.0 and higher, does not correspond with the modified Mercalli value. Compared to the same magnitude value, 7.0 and higher, based on image 1 the tampering by the USGS becomes more than obvious. When you’re rushing to get the fraudulent job done you make mistakes!!)

Image 3 (Berkeley University of California)
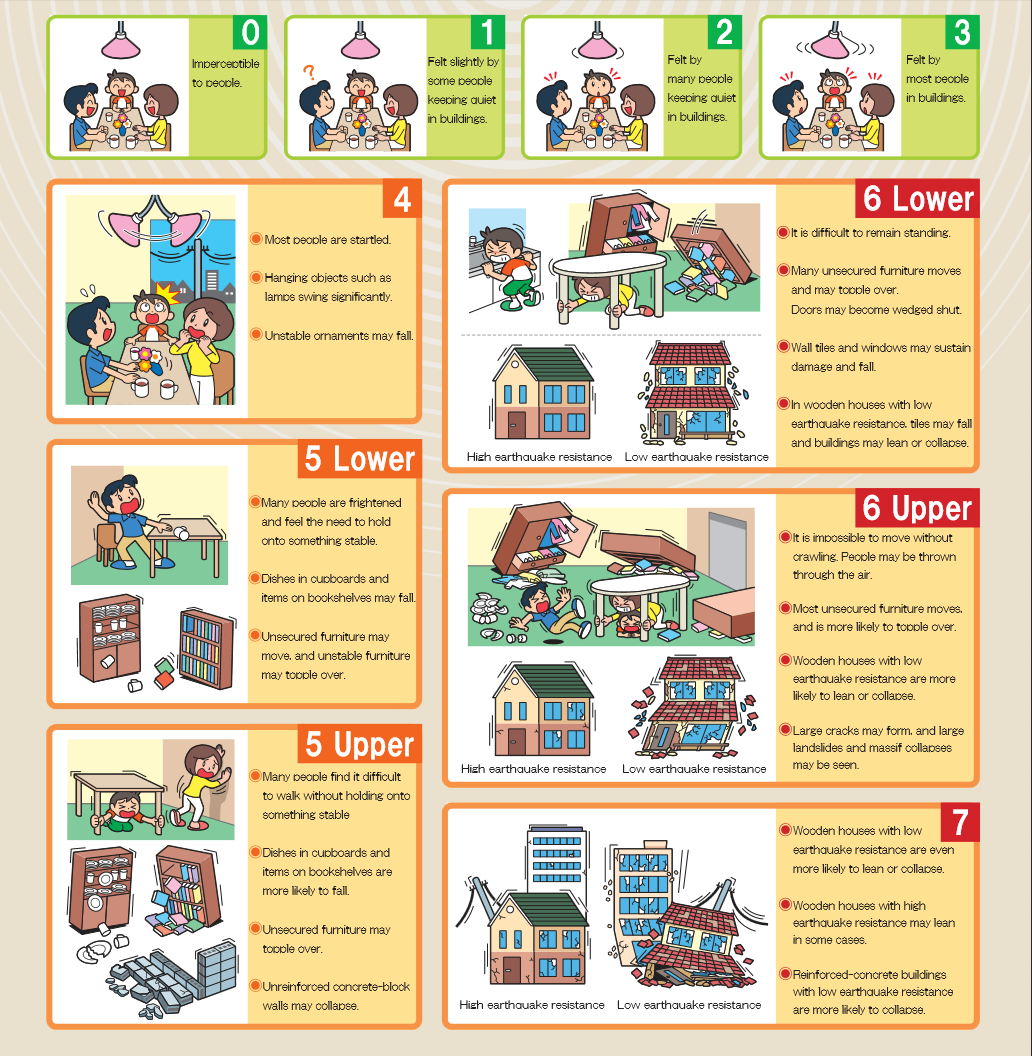
Image 4: Click to enlarge
